Your Dollars at Work

| Revenue | Amount |
|---|---|
|
General Revenue |
$135,889,666 |
|
Other Sources |
$43,754,749 |
|
Property Taxes |
$67,813,469 |
|
Total Revenues |
$247,457,884 |
2021 Revenue Sources
| Source | Percentage |
|---|---|
|
Province |
22% |
|
Water/Sewer Rates |
16% |
|
Reserve Transfer |
13% |
|
User Fees |
12% |
| Other Revenues | 3% |
| Federal |
3% |
| Development Charges |
2% |
| New Debt | 2% |
2021 Expenditure Distribution
| Expenditures | Percentage |
|---|---|
|
Wastewater |
18% |
|
Roads |
16% |
|
Woodingford Lodge |
13% |
| Other | 8% |
| Water | 7% |
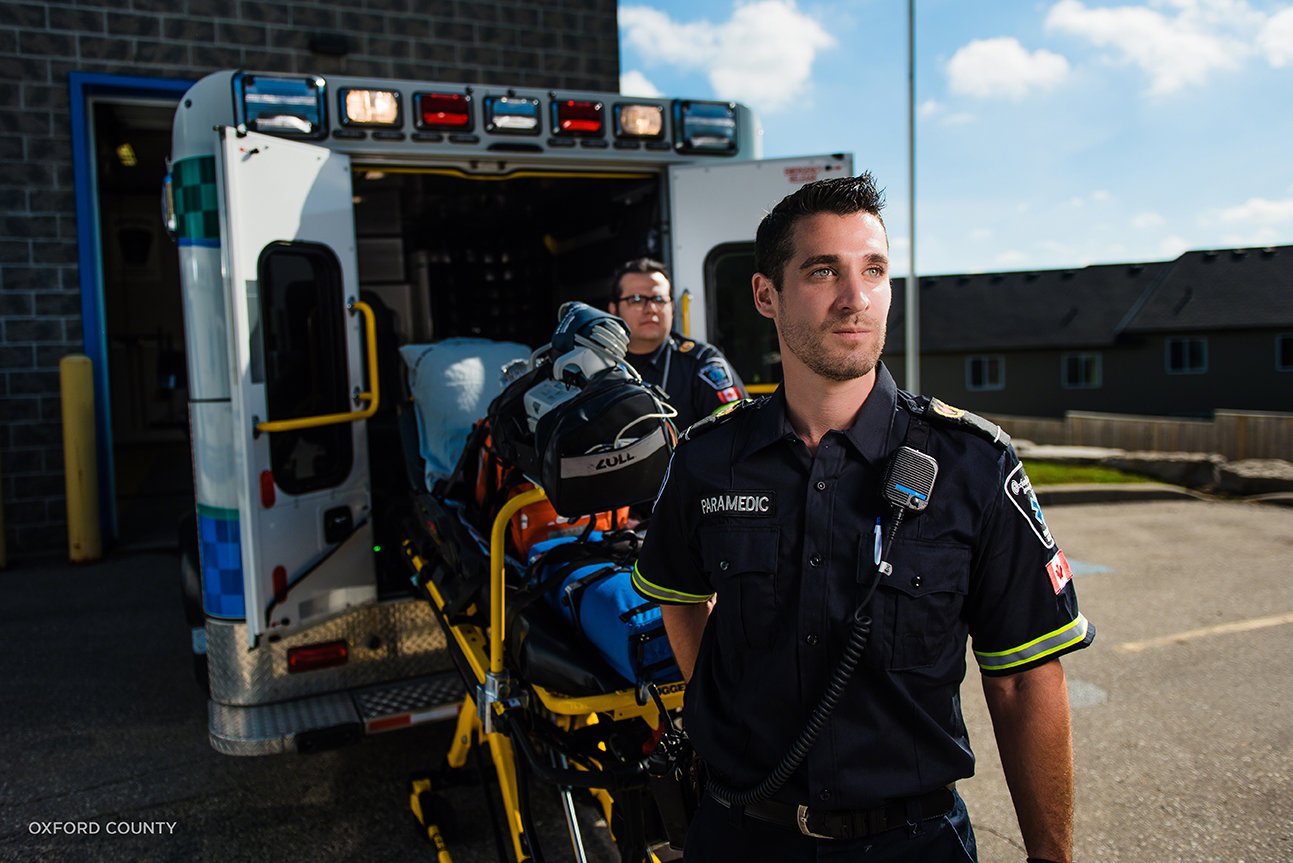
| Paramedic Services | 7% |
|
Waste Management |
6% |
|
Facilities |
2% |
|
Library |
2% |
|
Conservation Authorities |
1% |
|
Public Health |
1% |
|
Planning |
1% |
2021 Capital Expenditures (Millions)
| Expenditures | Amount |
|---|---|
| Fleet, Equipment & Furnishings | $1.67 |
| Corporate Facilities | $2.02 |
| Housing Facilities | $1.33 |
| Road Network | $12.02 |
| Stormwater Network | $1.93 |
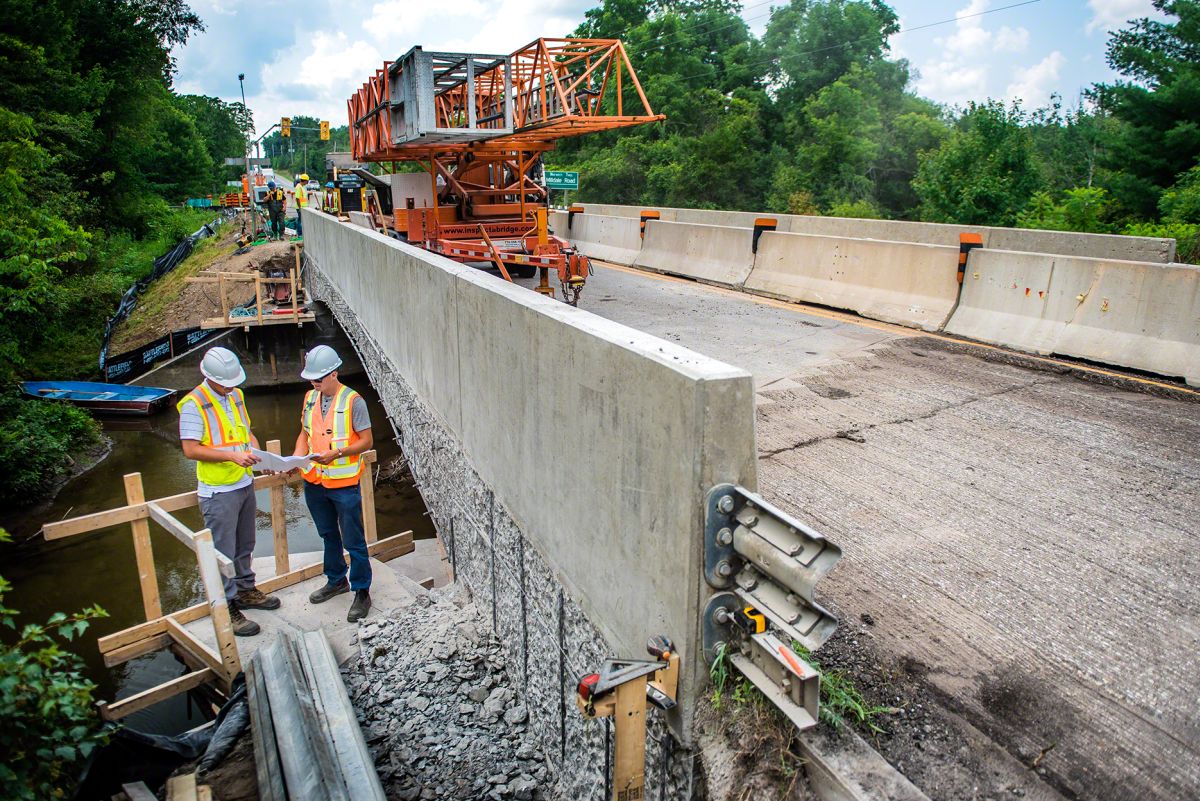
| Bridges and Major Culverts | $5.33 |
| Water Systems | $10.11 |
| Wastewater Systems | $8.03 |
| Total Expenditures (Millions) | $43.34 |